Your data sits scattered across spreadsheets, databases, and cloud systems. You need insights fast. Your team needs clear answers.
Power BI solves this problem.
What Is Power BI?
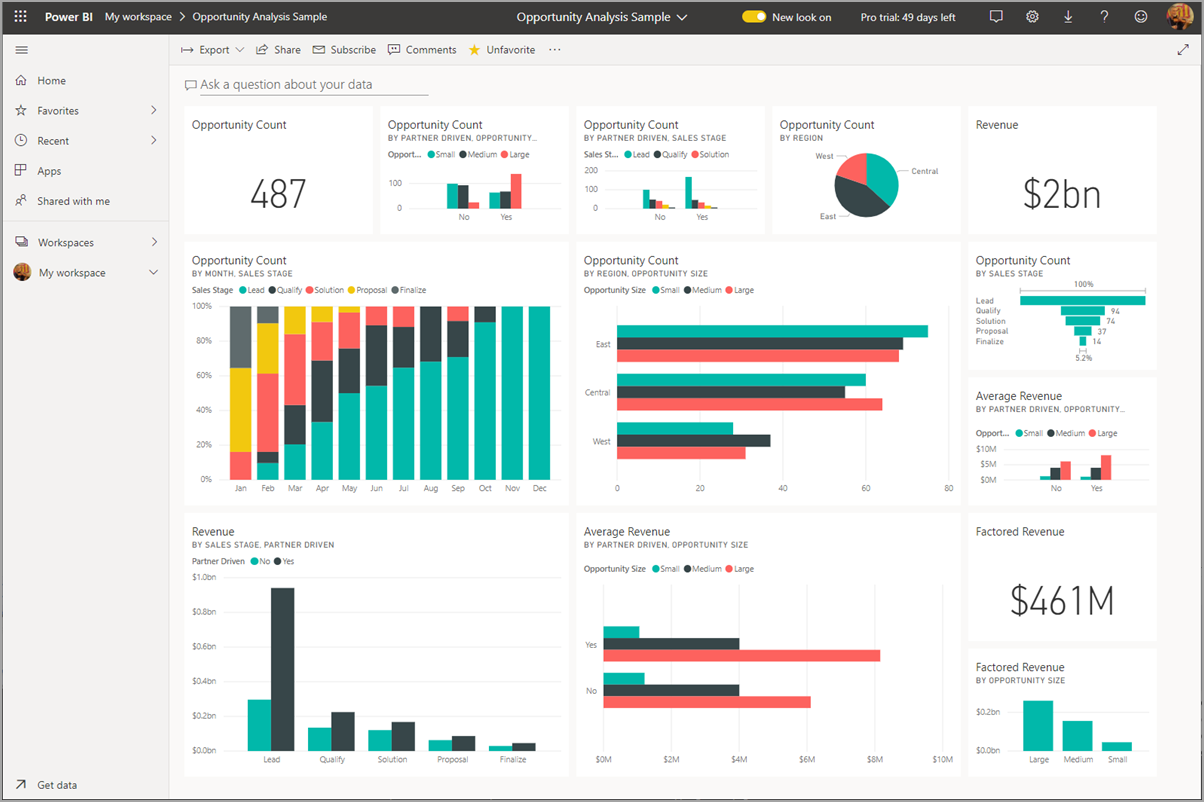
Power BI transforms your scattered data into clear, visual insights. It connects to Excel files, cloud databases, and on-premises systems. Then it turns that raw information into reports and dashboards that actually make sense.
Think about your current situation. Your sales data lives in one system. Your financial information sits in another. Your inventory numbers hide in spreadsheets across different departments.
Power BI pulls all this together automatically. You see your complete business picture in one place. Charts update in real-time as new data arrives. Trends become obvious instead of being buried in rows of numbers.
Your teams can share these insights instantly. Click a button and send a dashboard to your entire leadership team. Set up automatic reports that arrive in inboxes every Monday morning. No more hunting through endless spreadsheets or waiting for IT to run custom reports
The Five Components That Matter
| Component | Purpose | Best For |
| Power BI Desktop | Create reports and dashboards | Analysts building visualisations |
| Power BI Service | Share and collaborate online | Teams viewing and discussing data |
| Mobile Apps | Access data anywhere | Executives checking KPIs on the go |
| Report Builder | Create formatted reports | Finance teams needing printable invoices |
| Report Server | Keep data on-premises | Companies with strict security requirements |
How Your Teams Will Use It
Operations Managers
You check inventory levels in real-time dashboards. Manufacturing progress appears instantly on your screen. No more waiting for weekly reports.
Sales Directors
Your mobile app shows quota progress immediately. Drill down into lead details during client meetings. Make decisions with current data, not last week’s numbers.
Finance Teams
Generate formatted invoices automatically. Create reports that print perfectly. Pull data from multiple systems into one clear view.
The Workflow That Works
Your data journey follows these steps:
Connect your data sources in Power BI Desktop. Build your reports and charts. Publish to the Power BI Service. Share with your teams.
Teams view reports online or on mobile devices. They interact with the data. They ask new questions and get instant answers.
Business Central Integration: A Game-Changer for UK SMEs
 If you run Business Central, Power BI becomes even more powerful. The integration is seamless and immediate.
Business Central publishes ready-made Power BI apps on Microsoft AppSource. These apps create detailed dashboards automatically. No custom development needed.
Your financial data flows directly into visual reports. Sales performance appears in real-time charts. Inventory levels update automatically.
Three Ways to Access Your Data
| Access Method | Best For | Key Benefit |
| Power BI Service | Deep analysis and custom dashboards | Full Power BI functionality |
| Embedded in Business Central | Quick insights without switching systems | Seamless workflow |
| Mobile Apps | On-the-go decision making | Instant access anywhere |
Setup Requirements by Role
Your implementation needs differ based on your role:
Business Users: You need a Power BI account. Most Business Central licences include a free Power BI licence. Start viewing reports immediately.
Administrators: You control organisation-wide settings. You decide which data gets shared and how. You manage user access across both systems.
Report Creators: You need Power BI Desktop. You build custom reports that pull directly from Business Central data. You share these with your teams.
Microsoft Fabric Integration
Power BI now works within Microsoft Fabric. This means your data lake connects directly to your business intelligence tools.
Large organisations benefit most from this setup. You store massive amounts of data in one place. Power BI turns that data into business insights.
Your IT team manages everything from one admin panel. Your business teams still use the same Power BI tools they know.
On-Premises vs Cloud: Your Choice
Do you need to keep data behind your firewall? Power BI Report Server handles on-premises requirements.
You create reports the same way. Users access them through web browsers or mobile apps. When you’re ready to move to the cloud, the transition is seamless.
Questions to Ask Yourself
How much time does your team spend hunting for data?
What decisions are you delaying because you lack clear information?
How many different systems do you check to understand your business performance?
Power BI answers these challenges with one connected platform.
Getting Started
Your first step: identify your most critical data sources.
Map out who needs what information. Decide whether cloud or on-premises fits your security requirements.
Start with one department. Prove the value. Then expand across your organisation.
Your scattered data doesn’t have to stay scattered. Power BI brings it together so you can focus on running your business, not hunting for information.
Ready to Transform Your Data Strategy?
Stop wasting time on manual reports and fragmented insights.
Tecvia helps UK businesses implement Power BI solutions that deliver results from day one. We assess your current data landscape, design custom dashboards, and train your teams to use them effectively.
Book a free 30-minute consultation to discover how Power BI can streamline your operations and accelerate decision-making.