Manufacturing operations rely on accurate and timely data. Real-time visibility into production helps you understand what is happening on the shop floor at any moment. It allows managers to respond quickly to delays, track performance, and control costs before problems grow.
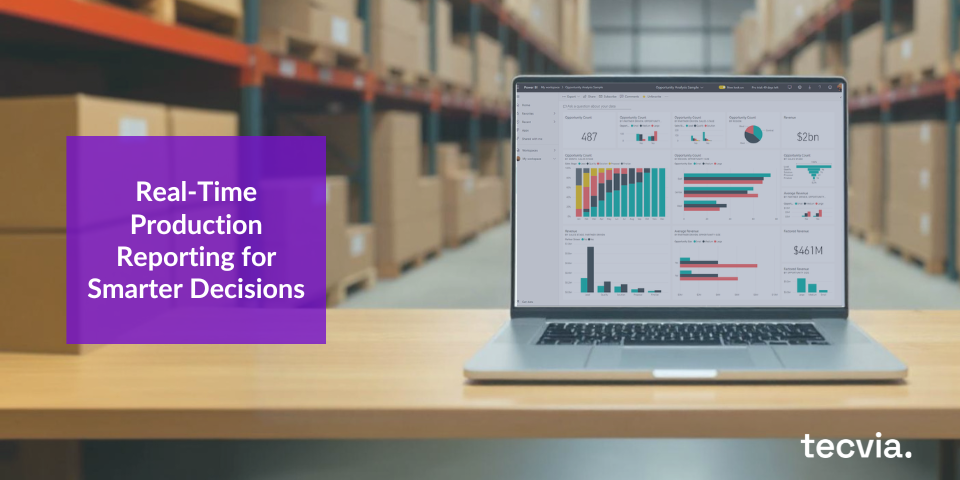
Real-time production reporting and business intelligence tools support this approach. Using Microsoft Power BI, you can collect data from your production system, analyse it, and present it in clear dashboards. These dashboards show key metrics such as output, downtime, and cost trends, giving your team a complete view of performance in one place.
At Tecvia, we help manufacturers connect their production data to Power BI. This creates clear, practical dashboards that show what’s happening on the shop floor. You gain visibility, control, and confidence in every decision.
Why Real-Time Reporting Matters
Production orders hold a lot of useful data once they are posted. They show:
- What was produced
- How long it took
- What materials were used
- How much it cost
Without clear reporting, this data stays hidden. With Power BI, you can pull it into live dashboards and use it to answer key questions:
- Are machines running as expected?
- Where are we losing time?
- Are our costs going up or down?
What to Track
Focus on the numbers that matter most to your operation.
1. Overall Equipment Effectiveness (OEE)
Measure how well your machines perform. OEE tracks:
- Availability: how often equipment is running
- Performance: how fast it runs
- Quality: how many good parts are made
With Power BI, you can see OEE by line, machine, or shift. You can quickly find out where time or quality is being lost.
2. Production Efficiency
Compare your actual output to your target.
Dashboards can show:
- Output by shift or operator
- Lost hours due to downtime or rework
- Trend lines over time
These insights help you take action before small delays become big issues.
3. Unit Cost Trends
Know how your production costs change over time. Track:
- Material costs per unit
- Labour costs per unit
- Overheads
Power BI helps you see patterns. If costs rise, you can find out why and take control.
How Power BI Fits In
You can connect Power BI directly to your production system, such as Microsoft Dynamics 365 Business Central.
The process is simple:
- Pull data from posted production orders and ledgers.
- Clean and shape it using Power Query.
- Build dashboards for OEE, output, and cost.
- Refresh data automatically during the day.
- Share dashboards with your team.
Everyone sees the same live view of performance. Decisions become faster and based on facts.
What You Gain
- Better visibility of shop floor performance
- Faster response to production issues
- Clear understanding of cost trends
- Stronger teamwork across departments
When your data is live and visible, action follows naturally.
Final Thoughts
Real-time production reporting gives you the clarity to act with confidence.
With Power BI, your production data becomes a daily guide, not a record of what already happened.
Tecvia helps you set up Power BI dashboards that make this possible.
Your team can track OEE, production output, and unit costs in real time and make smarter decisions every day.


