Power BI for Business Central

Turn Business Central Data into Clear Dashboards

Power BI turns your Business Central data into clear dashboards for finance, sales and operations. Tecvia sets it up for UK SMEs, so your team stops building reports by hand.

What Is Power BI for Business Central?

Power BI is Microsoft’s business intelligence tool. It connects directly to Dynamics 365 Business Central and turns your ERP data into visual dashboards and reports.

Your Business Central system already holds the figures you need, such as sales, stock levels, customer orders and financial transactions. Power BI pulls that data together into views your team can read at a glance.

You no longer wait until month-end to see how the business is performing. Dashboards refresh throughout the day, so nobody has to export data or rebuild spreadsheets.

Power BI also works alongside the Microsoft tools your team already uses, including Excel, Teams and Outlook. You can even view reports inside Business Central itself. See our Business Central features page for more on built-in reporting.
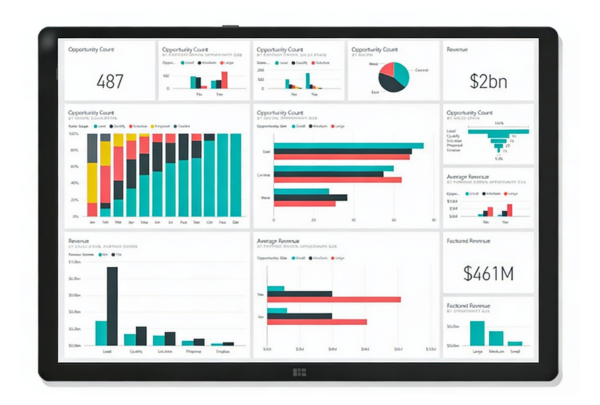

BI dashboard

How Power BI Connects to Business Central

Power BI connects to Business Central through built-in Microsoft connectors. Once your users have the right licences, you point Power BI at your Business Central environment and it starts reading your data.

Dashboards then refresh on a schedule, up to eight times a day on Power BI Pro. Each team in your business can have a view that is relevant to them.

Finance Teams

Your finance team sees profit and loss, balance sheets and expense tracking in visual form. Reports that once took hours to compile now refresh automatically, which cuts errors and frees up time.

Sales Teams

Sales managers can track regional performance through the day. They can see which areas are hitting targets and which need attention, without waiting for a weekly report.

Operations Teams

Your operations team can spot bottlenecks before they delay customer orders. Production output, fulfilment rates and stock levels all sit in one place.

Ready-Made Power BI Reports for Business Central

Microsoft provides free Power BI apps for Business Central in nine areas: finance, sales, purchasing, inventory, inventory valuation, projects, manufacturing, subscription billing and sustainability. You install them from Microsoft AppSource and connect them to your company data.

They give you a working set of reports before any custom build starts, which we then tailor to your processes.

Power BI for Manufacturing Businesses

Manufacturers need to know how production is performing today, not at month-end. Power BI gives you that view directly from your Business Central data, from the shop floor to the balance sheet.

Production Monitoring

Track machine utilisation and output across your shop floor. See which equipment runs at capacity and which sits idle, so you can act before it affects delivery.

Waste Reduction

Monitor scrap rates by product line. See where material waste is cutting into your margins and whether corrective actions are working.

Supplier Performance

See which suppliers deliver on time and which cause disruption. Use that data to make better decisions about your supply chain.

Labour Cost Analysis

Review labour costs per unit. Find out if overtime is eroding your margins, and compare actual costs against budget across production runs.

Find out more about how Business Central supports manufacturers on our Manufacturing and Engineering industry page.

Power BI for Distribution and Wholesale Businesses

Distribution is about speed and accuracy. Your customers expect fast delivery and correct orders. Power BI shows you where problems occur, so you can fix them before customers notice.

Warehouse Efficiency

Measure picking accuracy and identify which products or processes cause errors. Use that information to reduce mistakes and speed up fulfilment.

Delivery Performance

Track delivery success rates by carrier. See which logistics partners meet their commitments and which fall short.

Inventory Management

Monitor stock turnover and spot slow-moving lines. Freeing up cash tied up in idle stock is one of the quickest wins Power BI gives distributors. Read our guide to managing slow-moving stock.

Transport Costs

Review transport costs per delivery. Spot routes or carriers that cut into your margins, and compare performance across your logistics network.

See how Business Central works for distributors on our Distribution and Wholesale industry page.

Power BI for Food and Beverage, Life Sciences and Medical Devices

Food, drink, life sciences and medical device businesses all depend on traceability and tight quality control. Power BI turns the lot, expiry and inspection data already in Business Central into dashboards your team can check every day.

Yield and Waste

Compare actual yield against production targets and track waste by product line. See which batches lose margin and act before it adds up.

Shelf Life and Expiry

Spot stock nearing its use-by or expiry date before it becomes a write-off. Plan sales and production around what needs to move first.

Batch and Lot Traceability

Trace any batch from supplier to customer using lot and serial data from Business Central. Have audit and recall reports ready when you need them.

Quality and Compliance

Monitor inspection results, non-conformances and batch release times in one view. See how quality data feeds your reporting.

Find out more on our Food and Beverage, Life Sciences and Medical Devices industry pages, or read our guide to building a Power BI dashboard for life sciences KPIs.

Power BI vs Spreadsheets

Power BI vs Spreadsheets

Spreadsheets rely on manual work. Someone exports data from Business Central, pastes it in, then rebuilds the charts. By the time the report lands, the figures are already out of date.

Power BI connects straight to Business Central and refreshes throughout the day. Everyone opens the same dashboard, so decisions rest on one set of figures rather than competing spreadsheet versions.

SpreadsheetsPower BI
Getting dataManual export and copyDirect connection to Business Central
UpdatesWhen someone rebuilds the fileScheduled refresh, up to 8 times a day on Pro
SharingEmail attachments and file versionsOne shared dashboard with controlled access
Data volumeSlows down with large filesHandles years of transaction history
SecurityAnyone with the file sees everythingRow-level security limits what each user sees

Excel still has its place. Your team can open Power BI data in Excel for a quick pivot table, without breaking the link to the source figures.

BI for Business Central

Why Business Central Customers Work with Tecvia on Power BI

Tecvia implements and supports Business Central for UK manufacturers, distributors, food and beverage producers, and life sciences and medical device companies. We know which figures matter in your sector, so we build dashboards around the questions your team actually asks.

  1. 1Scope: We agree what you need to measure and which Business Central data feeds it.
  2. 2Build: We start from Microsoft’s ready-made reports and tailor them to your processes.
  3. 3Train: Your team learns to read, filter and share dashboards with confidence.
  4. 4Expand: Once the first dashboard proves its value, we extend it to other areas of the business.

Most clients have their first dashboard live within two weeks. As a Manchester-based Microsoft Solutions Partner, we stay on hand to support and develop your reports after launch.

Talk to Us about Power BI for Business Central

Start with a free, no-obligation call. We look at the reports you run today, show you what Microsoft’s ready-made Power BI apps already cover, and give you a clear picture of cost and timescale.

  • ✓A same-day reply: we aim to come back to you the same working day, with someone who knows the product.
  • ✓A short call: we talk through the reports you rely on and where they fall short.
  • ✓A written outline: we set out cost and timescale, with your first dashboard live within two weeks of starting.

Further reading: our Power BI guide, Business Central pricing and Business Central features.

Power BI dashboard overview for Business Central

FAQ

Power BI is Microsoft’s business intelligence platform. It connects directly to Dynamics 365 Business Central and turns your existing data into visual dashboards and reports. Your team sees up-to-date figures on sales, finance, stock and operations without exporting data by hand.

Power BI connects to Business Central through built-in Microsoft connectors. It reads your data automatically, with no manual exports required. Dashboards update throughout the day as your business data changes. 

Yes. Manufacturers use Power BI to track production efficiency, monitor scrap rates, analyse supplier performance, and review labour costs per unit. All of that data comes directly from Business Central, so there is nothing to set up separately. 

Yes. Distributors use Power BI to measure picking accuracy, track delivery performance by carrier, monitor stock turnover, and review transport costs per delivery. It gives you a clear view of where your operation is performing and where it is not. 

Power BI Pro costs £10.80 per user per month at the time of writing, billed annually. Implementation costs depend on how many dashboards you need and whether you use external support to build them. Most businesses have their first dashboard live within two weeks.

Every user who installs, refreshes or views the reports needs a Power BI Pro licence, at £10.80 per user per month. They also need a paid Business Central licence, such as Essentials, Premium or Team Member. Free Power BI licences do not work with Microsoft’s ready-made Business Central apps. Larger teams can use Power BI Premium capacity instead.

No. Dashboards are designed for business users, not technical teams. If your team can read Excel, they can use Power BI. Most users learn to navigate and interact with dashboards within a few hours. 

Most businesses have some data quality issues. You do not need perfect data to start. Beginning with one clean dataset, such as your sales figures, is usually the best approach. Power BI can also help you identify where your data has problems, which you can fix gradually. 

Most clients have their first dashboard live within two weeks of starting. That covers the scoping conversation, the build and a review with your team. The technical build is quick once you are clear on what you want to measure.

Yes. Starting with one dashboard that answers your most pressing business question is the approach we recommend. Once you see the value, you can expand to other areas. This reduces risk and builds confidence in your team before you commit to a larger rollout. 

Excel reports need manual data exports and updates. Power BI connects directly to Business Central and refreshes automatically throughout the day. Everyone in your business sees the same up-to-date dashboard, so decisions rest on current figures rather than a spreadsheet last updated on Friday afternoon.

Yes. Smaller businesses often benefit most from Power BI because they cannot afford to make decisions based on outdated information. A business with fifteen staff can access the same reporting capability as a much larger organisation. The platform scales to your size and complexity.